Gantt Chart is a great tool that helps us visualize our project schedules. It makes task timelines more visible and thus trackable, and it also enables stakeholders within the organization to manage their tasks and timelines at a glance.
On Backlog, the Gantt chart feature is available for our Standard Plan & above accounts. By ticking ‘Enable charts’ at the project settings page, Gantt chart function will be made available for the project.

Types of Gantt Chart
There are 2 types of Gantt charts available on Backlog: Project Gantt chart and Personal Gantt chart.
You can find the project’s Gantt chart within the individual project if the administrator has enabled it at the project settings page.
For your personal Gantt chart, you can access it by selecting your personal icon on the global navigation bar.

How it works
Here’s a review of how Gantt chart works on Backlog.

Sections:
- Filters
Display of the Gantt chart can be filtered based on the 4 settings - Start Date, Grouping, Span and Status of the task.
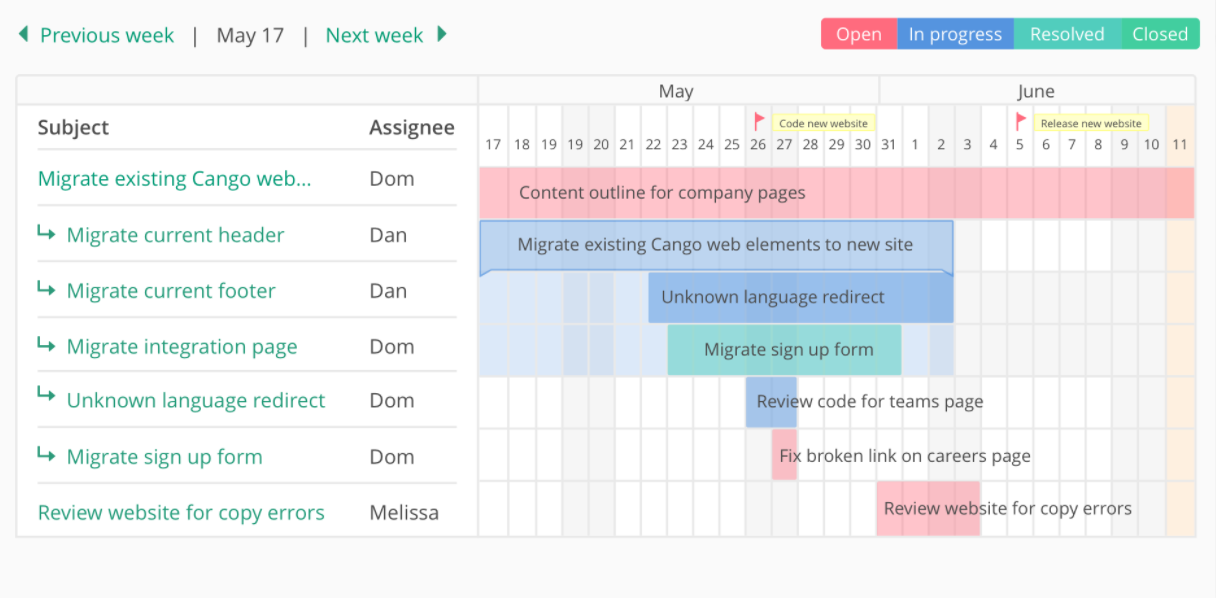
- Gantt Chart display
The display will reflect the filtered results and tasks timeline. Each task’s progress is color-coded according to its status: Open, In Progress, Resolved & Closed.
Three issue attributes — Assignee, Start Date & Due Date — can be managed by clicking the “Edit” tab.
Each issue’s timeline can be easily adjusted by dragging the issue or pulling its ends.
Milestones (e.g. the flag with M1-1.0) are also reflected on the chart’s timeline to help members keep track of significant deadlines.
Note: Drag and drop to alter task timeline function only available in the Project Gantt Chart.
- Export Excel
To export the current Gantt chart, simply select “Export Excel” to download the file.
That’s all for our Gantt Chart overview.
Share with us what you think about this feature and how it helps you and your team to manage your projects and task timelines effectively.
Cheers! ![]()